 On 26 April 2017, IP Australia celebrated
 The OECD assessment featured in its 2015 Science, Technology and Industry Scoreboard, and was based on data provided by the Australian Bureau of Statistics (ABS) survey. That data, in turn, was based upon a survey of Australian businesses conducted in relation to activities in the 2010/11 financial year (the most recent ABS data on ‘Innovation in Australian Business’ is available from its website). This measure has been criticised as failing to account for the particular nature of the Australian market – having a small number of large universities and research organisations, and a large number of small firms – and of failing to compare apples with apples, given that most of the other OECD nations used measures based on a European survey not implemented in Australia.
IP Australia’s research takes up that criticism, noting that ‘asking those firms how often they collaborated with a university is likely to under-estimate the totals’. Instead, it seeks to use an objective, data-driven, measure of collaboration – namely, the incidence of universities co-filing applications for a patents or other IP rights with industry-based partners. On this measure, Australia ranks 13th of 35 countries, above average and ahead of many countries that rated very highly in the OECD rankings, such as Finland (first on OECD data), Slovenia (2), Austria (3), Hungary (4), Sweden (5), Germany (7), Norway (8), Denmark (9) and Japan (12).
Personally, I do not believe either set of data. But at least we now have two different perspectives on measuring collaboration which may encourage policy-makers to view the OECD rankings with the scepticism they deserve!
OECD Collaboration Figures
Before turning to IP Australia’s results, it is worth having a look at the original OECD data, because it is pretty shocking.
As you can see, Australia was not merely last, it was the worst-performing country by a significant margin, lagging well behind Brazil, Chile and Mexico.
What are we to make of this? That Australia achieves sub-developing-nation standards of industry-research collaboration? That there is something wrong with the data? Or something else...?
Simply saying, without more context, that Australia ranked last out of 33 OECD nations sounds vaguely plausible, especially if a headline result like this suits a particular agenda. But when you then look at the nations on the list, and at the actual numbers, you really have to conclude that, in the absence of some form of independent corroborating evidence, this data is not to be trusted.
An Alternative Approach – IP Rights Application Data
Instead of relying on survey data, IP Australia’s researchers looked at 15 years of IP rights filing data, and found that:...every university in Australia undertook at least one collaborative IP application. They collaborated with more than 400 organisations over this period, connecting 2212 times with each other across 1037 connections, and many collaborative arrangements feature more than one collaboration partner.
These relationships are convincingly, if somewhat confusingly, illustrated by a graphic showing the network of collaborations (if this interests you, I would encourage you to visit the original, which is interactive and allows you to pan and zoom around the image).

The ‘bubbles’ in this graphic represent various entities, where universities are shown in purple, government collaborators, such as the Commonwealth Scientific and Industrial Research Organisation (CSIRO) are grey, and all private sector and third party co-applicants are white. The size of each bubble indicates the number of IP rights co-filed by the entity. Co-applicants are connected by lines, with blue indicating patents, red trade marks, yellow plant breeder’s rights and green registered designs.
How Australia Compares Internationally
To compare Australia’s performance internationally, the Patent Analytics Hub at IP Australia looked at international patent filings, i.e. applications filed under the Patent Cooperation Treaty (PCT), having university and industry co-applicants. The resulting interactive chart (Figure 17 in the Report) is embedded below.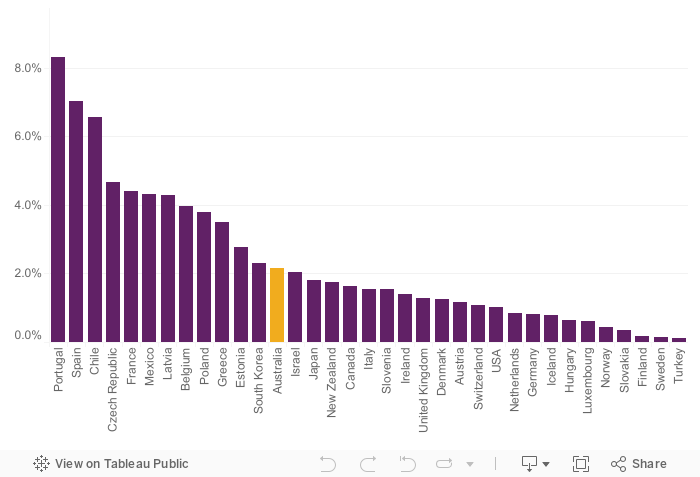
The chart shows the share (i.e. percentage) of PCT applications filed by university-industry collaborators out of all PCT applications originating in an OECD country between 2000 and 2015. On this measure, Australia ranks above average, at position 13 out of 35 countries.
The number of applications naming universities as co-applicants with industry partners is only a partial measure of collaborative activity. As the Report itself notes, ‘patent data only measures a specific type of collaboration, and other forms of knowledge transfer (or links between entities) are not represented and hence this measure underestimates the total interactions.’
This underestimation occurs for all countries, and a key question is therefore whether there are differences in the dominant forms of collaboration and knowledge transfer in different countries. Many forms of collaboration do not necessarily involve the creation of patentable IP and/or the filing of patent applications, e.g. software development, the sharing of biological materials, and various forms of experimental research contracts, to name but a few.
Additionally, even where patentable technology is involved, this will not always be reflected in co-application. In some cases, patents may initially be filed by the university alone, and subsequently assigned or licensed to one or more industry partners. Even where there is collaboration from the outset, any resulting patent rights may be owned under contract by one partner or the other, or may be held by a single joint venture company established for the purpose of managing and/or commercialising the technology. A variety of factors may contribute to a preference for structure over others in a given country. For example, the US Bayh-Dole Act provides incentives for universities to retain title to inventions and take the lead in patenting and licensing new technology. Tax-based and other forms of government incentives may, likewise, encourage private sector partners to direct collaborative activities and to own any IP generated in the course of research and development.
Conclusion – More Useful Than OECD Measure?
It stretches plausibility to assert, as IP Australia’s chart suggests, that Australia is performing better in university-industry collaboration than all such countries as the UK, USA, Germany, the Netherlands, Denmark, Norway, Finland and Sweden. It is even less believable that Finland and Sweden would be in the bottom three for collaboration, where they sit on IP Australia’s measure, when they rank first and fifth respectively in the OECD figures.But at least we know where IP Australia’s figures come from, what they mean, and what their potential limitations and blind spots are. And we know, as a result, that there is an objective measure according to which Australia sits around the middle of the OECD pack on industry-research collaboration. This is much more consistent with where we might expect to find Australia, based on broader economic, educational and research measures, as well as the experience of many of us who have worked in and for universities and commercial enterprises.
Another advantage of using IP rights data is that it is, in some sense, a measure of productive outcomes from collaboration, rather than merely of some collaborative work having taken place. Presumably, for example, a joint patent application will only be filed if the parties believe that some valuable technological innovation has been developed in the course of their collaboration.
IP Australia’s numbers may therefore be a better starting point than the OECD data for a productive conversation about how we go about setting policy levers to encourage and support collaborative innovation in Australia, and how we measure the outcomes.
Before You Go…
Thank you for reading this article to the end – I hope you enjoyed it, and found it useful. Almost every article I post here takes a few hours of my time to research and write, and I have never felt the need to ask for anything in return.
But now – for the first, and perhaps only, time – I am asking for a favour. If you are a patent attorney, examiner, or other professional who is experienced in reading and interpreting patent claims, I could really use your help with my PhD research. My project involves applying artificial intelligence to analyse patent claim scope systematically, with the goal of better understanding how different legal and regulatory choices influence the boundaries of patent protection. But I need data to train my models, and that is where you can potentially assist me. If every qualified person who reads this request could spare just a couple of hours over the next few weeks, I could gather all the data I need.
The task itself is straightforward and web-based – I am asking participants to compare pairs of patent claims and evaluate their relative scope, using an online application that I have designed and implemented over the past few months. No special knowledge is required beyond the ability to read and understand patent claims in technical fields with which you are familiar. You might even find it to be fun!
There is more information on the project website, at claimscopeproject.net. In particular, you can read:
- a detailed description of the study, its goals and benefits; and
- instructions for the use of the online claim comparison application.
Thank you for considering this request!
Mark Summerfield

0 comments:
Post a Comment